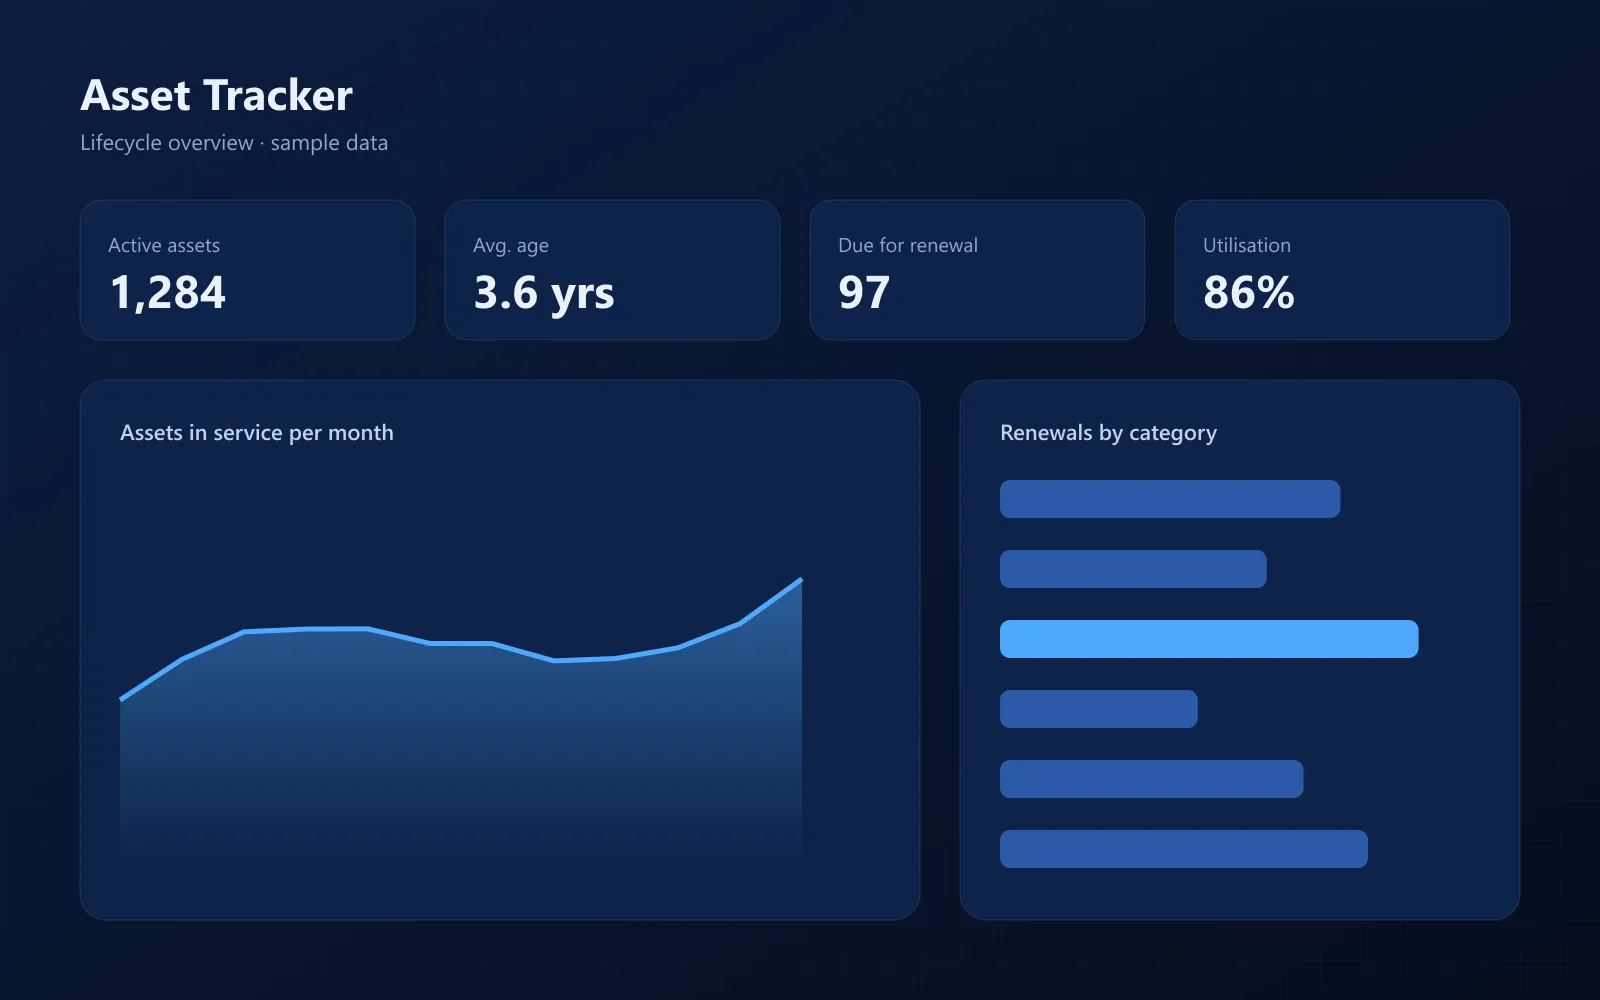
Asset Tracker Dashboard
One view of 1,284 assets across five sites — age, cost, status and what's due for renewal. Built on a dummy register.
The Data Lab
Power BI dashboards, analysis and Excel work. Open any project for the story, the numbers and the files.
1 project
One view of 1,284 assets across five sites — age, cost, status and what's due for renewal. Built on a dummy register.